Tutorial 2 - Merge#
[ ]:
import matplotlib.pyplot as plt

import pydpeet as eet

eet.set_logging_style("ERROR")
[ ]:
Datas = eet.read(config="neware_8_0_0_516", input_path=r"..\..\res\raw")
[ ]:
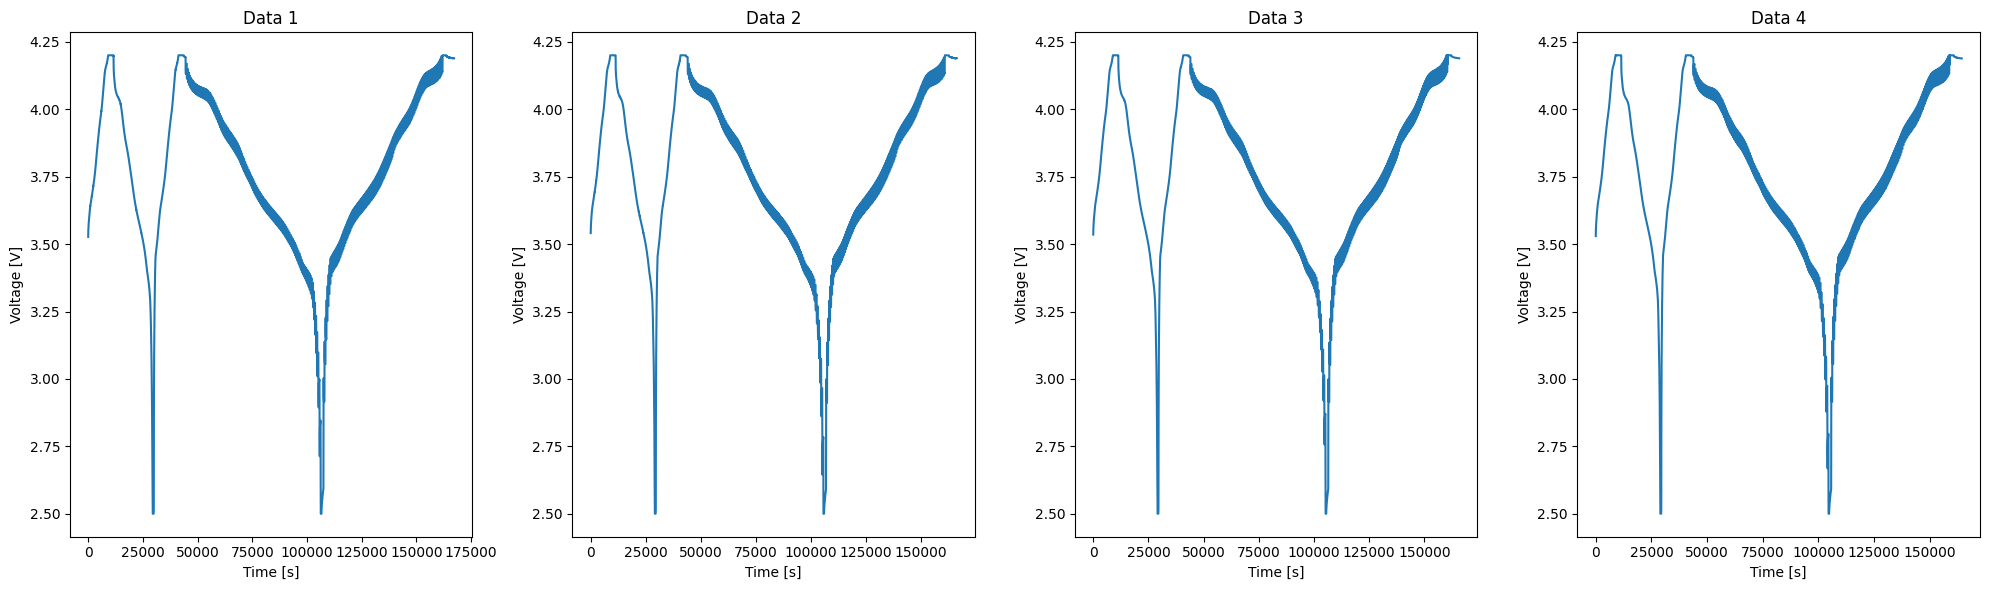
fig, ax = plt.subplots(1, len(Datas), figsize=(5 * len(Datas), 6))

for i, data in enumerate(Datas):
    ax[i].plot(data["Test_Time[s]"], data["Voltage[V]"], label=f"Data {i+1}")
    ax[i].set_title(f"Data {i+1}")
    ax[i].set_xlabel("Time [s]")
    ax[i].set_ylabel("Voltage [V]")
    fig.tight_layout()
[ ]:
Merged_Data = eet.merge_into_series(Datas)
Merged_Data.head()
| Meta_Data | Step_Count | Voltage[V] | Current[A] | Temperature[°C] | Test_Time[s] | Date_Time | EIS_f[Hz] | EIS_Z_Real[Ohm] | EIS_Z_Imag[Ohm] | EIS_DC[A] | TestIndex | |
|---|---|---|---|---|---|---|---|---|---|---|---|---|
| 0 | 20240201100904-CheckUp-3-7-AM23NMC00009.xlsx U... | 0.0 | 3.5269 | 1.4378 | 27.8 | 0.0 | 2024-02-01 10:09:04 | None | None | None | None | 0.0 |
| 1 | NaN | 0.0 | 3.5287 | 1.4398 | 27.8 | 1.0 | 2024-02-01 10:09:05 | None | None | None | None | 0.0 |
| 2 | NaN | 0.0 | 3.5298 | 1.4400 | 27.8 | 2.0 | 2024-02-01 10:09:06 | None | None | None | None | 0.0 |
| 3 | NaN | 0.0 | 3.5307 | 1.4400 | 27.8 | 3.0 | 2024-02-01 10:09:07 | None | None | None | None | 0.0 |
| 4 | NaN | 0.0 | 3.5315 | 1.4401 | 27.8 | 4.0 | 2024-02-01 10:09:08 | None | None | None | None | 0.0 |
[ ]:
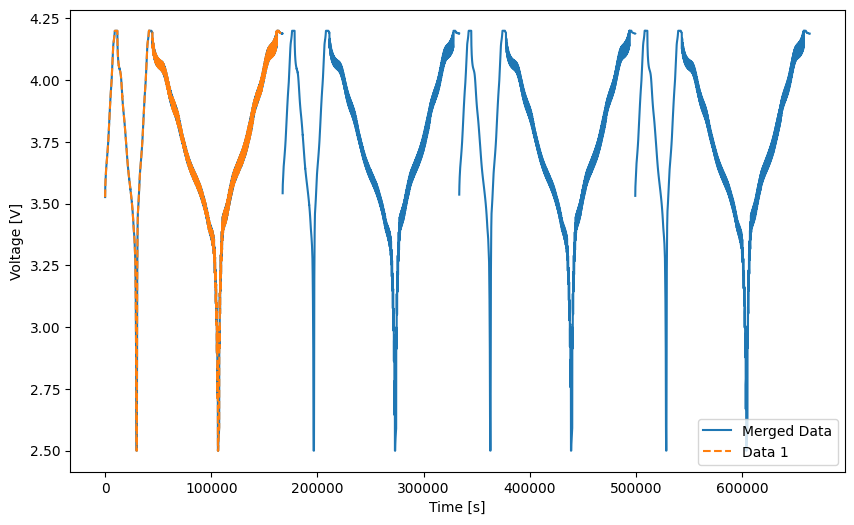
fig, ax = plt.subplots(figsize=(10, 6))

p = 0

ax.plot(Merged_Data["Test_Time[s]"], Merged_Data["Voltage[V]"], label="Merged Data")
ax.plot(Datas[p]["Test_Time[s]"], Datas[p]["Voltage[V]"], label=f"Data {p+1}", linestyle="--")
ax.set_xlabel("Time [s]")
ax.set_ylabel("Voltage [V]")
ax.legend()
<matplotlib.legend.Legend at 0x197bab87e00>