Tutorial 5 - SOC#
[1]:
import matplotlib.pyplot as plt

import pydpeet as eet

eet.set_logging_style("ERROR")
[2]:
Data = eet.read(config="neware_8_0_0_516", input_path=r"..\..\res\raw\Cal_Ageing_Checkup3.xlsx")
Data.head()
[2]:
| Meta_Data | Step_Count | Voltage[V] | Current[A] | Temperature[°C] | Test_Time[s] | Date_Time | EIS_f[Hz] | EIS_Z_Real[Ohm] | EIS_Z_Imag[Ohm] | EIS_DC[A] | |
|---|---|---|---|---|---|---|---|---|---|---|---|
| 0.0 | 20240419100603-CheckUp-1-6-AM23NMC00009.xlsx U... | 0 | 3.5353 | 1.4396 | 30.1 | 0.0 | 2024-04-19 10:06:03 | None | None | None | None |
| 1.0 | None | 0 | 3.5368 | 1.4397 | 30.1 | 1.0 | 2024-04-19 10:06:04 | None | None | None | None |
| 2.0 | None | 0 | 3.5379 | 1.4398 | 30.1 | 2.0 | 2024-04-19 10:06:05 | None | None | None | None |
| 3.0 | None | 0 | 3.5388 | 1.4398 | 29.9 | 3.0 | 2024-04-19 10:06:06 | None | None | None | None |
| 4.0 | None | 0 | 3.5396 | 1.4399 | 29.9 | 4.0 | 2024-04-19 10:06:07 | None | None | None | None |
[3]:
Data_segmented = eet.add_primitive_segments(Data)
Data_segmented.head()
[3]:
| Meta_Data | Step_Count | Voltage[V] | Current[A] | Temperature[°C] | Test_Time[s] | Date_Time | EIS_f[Hz] | EIS_Z_Real[Ohm] | EIS_Z_Imag[Ohm] | ... | ID | Variable | Duration | Length | Min | Max | Avg | Type | Direction | Slope | |
|---|---|---|---|---|---|---|---|---|---|---|---|---|---|---|---|---|---|---|---|---|---|
| 0.0 | 20240419100603-CheckUp-1-6-AM23NMC00009.xlsx U... | 0 | 3.5353 | 1.4396 | 30.1 | 0.0 | 2024-04-19 10:06:03 | None | None | None | ... | 1 | I | 8873.0 | 8872.0 | 1.4388 | 1.44 | 1.439794 | Constant | Charge | -9.017133e-08 |
| 1.0 | None | 0 | 3.5368 | 1.4397 | 30.1 | 1.0 | 2024-04-19 10:06:04 | None | None | None | ... | 1 | I | 8873.0 | 8872.0 | 1.4388 | 1.44 | 1.439794 | Constant | Charge | -9.017133e-08 |
| 2.0 | None | 0 | 3.5379 | 1.4398 | 30.1 | 2.0 | 2024-04-19 10:06:05 | None | None | None | ... | 1 | I | 8873.0 | 8872.0 | 1.4388 | 1.44 | 1.439794 | Constant | Charge | -9.017133e-08 |
| 3.0 | None | 0 | 3.5388 | 1.4398 | 29.9 | 3.0 | 2024-04-19 10:06:06 | None | None | None | ... | 1 | I | 8873.0 | 8872.0 | 1.4388 | 1.44 | 1.439794 | Constant | Charge | -9.017133e-08 |
| 4.0 | None | 0 | 3.5396 | 1.4399 | 29.9 | 4.0 | 2024-04-19 10:06:07 | None | None | None | ... | 1 | I | 8873.0 | 8872.0 | 1.4388 | 1.44 | 1.439794 | Constant | Charge | -9.017133e-08 |
5 rows × 22 columns
[4]:
Battery_Config = eet.lgm50lt_nmc_4800
method = eet.SocMethod.WITH_RESET_WHEN_FULL

# todo: is it possible to probide acces to the Batemo/About-Energy database and fetch battery configs directly from there?
# todo: or we download it and provide the databse directly?

Result = eet.add_soc(df=Data, df_primitives=Data_segmented, standard_method=method, config=Battery_Config)
Result.head()
[4]:
| Meta_Data | Step_Count | Voltage[V] | Current[A] | Temperature[°C] | Test_Time[s] | Date_Time | EIS_f[Hz] | EIS_Z_Real[Ohm] | EIS_Z_Imag[Ohm] | EIS_DC[A] | Capacity[Ah] | SOC | |
|---|---|---|---|---|---|---|---|---|---|---|---|---|---|
| 0.0 | 20240419100603-CheckUp-1-6-AM23NMC00009.xlsx U... | 0 | 3.5353 | 1.4396 | 30.1 | 0.0 | 2024-04-19 10:06:03 | None | None | None | None | NaN | 0.203377 |
| 1.0 | None | 0 | 3.5368 | 1.4397 | 30.1 | 1.0 | 2024-04-19 10:06:04 | None | None | None | None | NaN | 0.203461 |
| 2.0 | None | 0 | 3.5379 | 1.4398 | 30.1 | 2.0 | 2024-04-19 10:06:05 | None | None | None | None | NaN | 0.203544 |
| 3.0 | None | 0 | 3.5388 | 1.4398 | 29.9 | 3.0 | 2024-04-19 10:06:06 | None | None | None | None | NaN | 0.203627 |
| 4.0 | None | 0 | 3.5396 | 1.4399 | 29.9 | 4.0 | 2024-04-19 10:06:07 | None | None | None | None | NaN | 0.203711 |
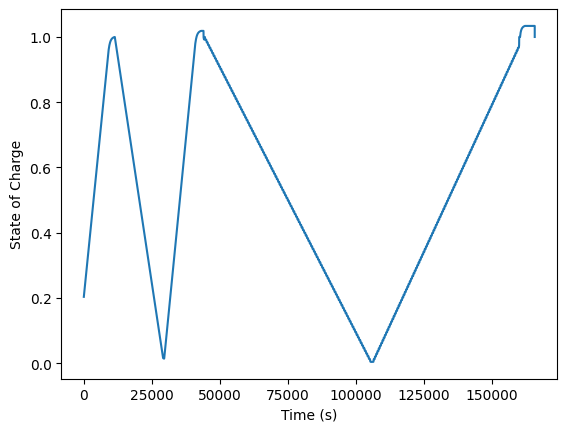
[7]:
fig, ax = plt.subplots()
ax.plot(Result["Test_Time[s]"], Result["SOC"])
ax.set_xlabel("Time (s)")
ax.set_ylabel("State of Charge")
plt.show()