Tutorial 6 - SOH-C#
[22]:
import matplotlib.pyplot as plt

import pydpeet as eet

eet.set_logging_style("ERROR")
[23]:
Datas = eet.read(config="neware_8_0_0_516", input_path=r"..\..\res\raw")
Data = eet.merge_into_series(Datas)
[24]:
Data_segmented = eet.add_primitive_segments(Data)
Data_segmented.head()
[24]:
| Meta_Data | Step_Count | Voltage[V] | Current[A] | Temperature[°C] | Test_Time[s] | Date_Time | EIS_f[Hz] | EIS_Z_Real[Ohm] | EIS_Z_Imag[Ohm] | ... | ID | Variable | Duration | Length | Min | Max | Avg | Type | Direction | Slope | |
|---|---|---|---|---|---|---|---|---|---|---|---|---|---|---|---|---|---|---|---|---|---|
| 0 | 20240201100904-CheckUp-3-7-AM23NMC00009.xlsx U... | 0.0 | 3.5269 | 1.4378 | 27.8 | 0.0 | 2024-02-01 10:09:04 | None | None | None | ... | 1 | V | 9112.0 | 9111.0 | 3.5269 | 4.2001 | 3.889836 | Ramp | Up | 0.000074 |
| 1 | None | 0.0 | 3.5287 | 1.4398 | 27.8 | 1.0 | 2024-02-01 10:09:05 | None | None | None | ... | 1 | V | 9112.0 | 9111.0 | 3.5269 | 4.2001 | 3.889836 | Ramp | Up | 0.000074 |
| 2 | None | 0.0 | 3.5298 | 1.4400 | 27.8 | 2.0 | 2024-02-01 10:09:06 | None | None | None | ... | 1 | V | 9112.0 | 9111.0 | 3.5269 | 4.2001 | 3.889836 | Ramp | Up | 0.000074 |
| 3 | None | 0.0 | 3.5307 | 1.4400 | 27.8 | 3.0 | 2024-02-01 10:09:07 | None | None | None | ... | 1 | V | 9112.0 | 9111.0 | 3.5269 | 4.2001 | 3.889836 | Ramp | Up | 0.000074 |
| 4 | None | 0.0 | 3.5315 | 1.4401 | 27.8 | 4.0 | 2024-02-01 10:09:08 | None | None | None | ... | 1 | V | 9112.0 | 9111.0 | 3.5269 | 4.2001 | 3.889836 | Ramp | Up | 0.000074 |
5 rows × 23 columns
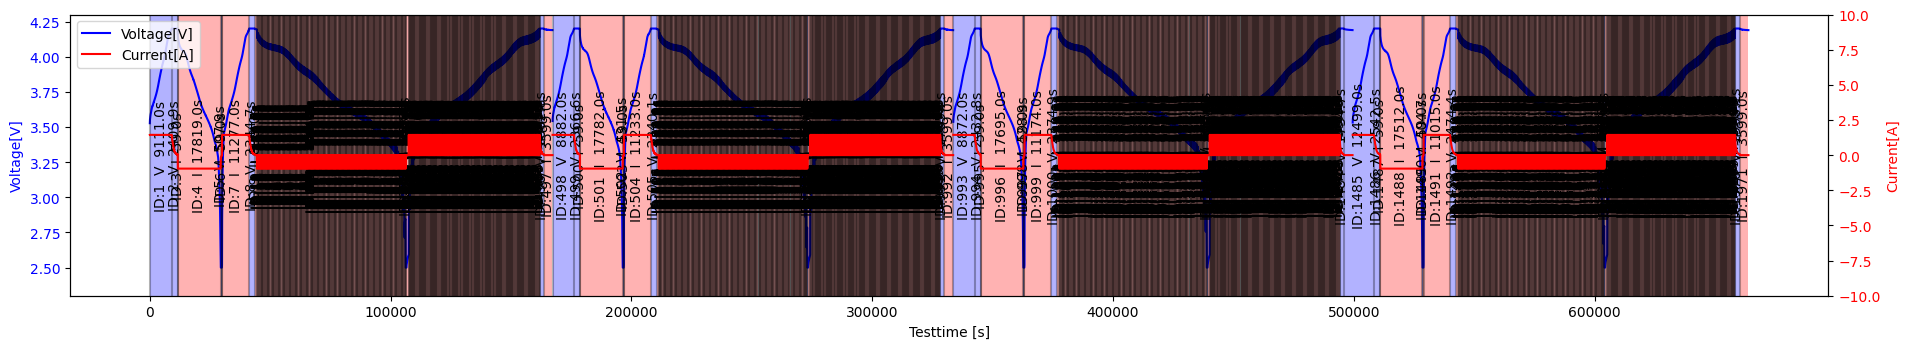
[25]:
eet.visualize_phases(dataframe=Data_segmented)
plt.show()
[26]:
Battery_Config = eet.lgm50lt_nmc_4800

results = eet.add_capacity(Data, Data_segmented, neware_bool=True, config=Battery_Config)  # todo: fix
results.head()
[26]:
| Meta_Data | Step_Count | Voltage[V] | Current[A] | Temperature[°C] | Test_Time[s] | Date_Time | EIS_f[Hz] | EIS_Z_Real[Ohm] | EIS_Z_Imag[Ohm] | EIS_DC[A] | TestIndex | Capacity[Ah] | |
|---|---|---|---|---|---|---|---|---|---|---|---|---|---|
| 0 | 20240201100904-CheckUp-3-7-AM23NMC00009.xlsx U... | 0.0 | 3.5269 | 1.4378 | 27.8 | 0.0 | 2024-02-01 10:09:04 | None | None | None | None | 0.0 | NaN |
| 1 | None | 0.0 | 3.5287 | 1.4398 | 27.8 | 1.0 | 2024-02-01 10:09:05 | None | None | None | None | 0.0 | NaN |
| 2 | None | 0.0 | 3.5298 | 1.4400 | 27.8 | 2.0 | 2024-02-01 10:09:06 | None | None | None | None | 0.0 | NaN |
| 3 | None | 0.0 | 3.5307 | 1.4400 | 27.8 | 3.0 | 2024-02-01 10:09:07 | None | None | None | None | 0.0 | NaN |
| 4 | None | 0.0 | 3.5315 | 1.4401 | 27.8 | 4.0 | 2024-02-01 10:09:08 | None | None | None | None | 0.0 | NaN |
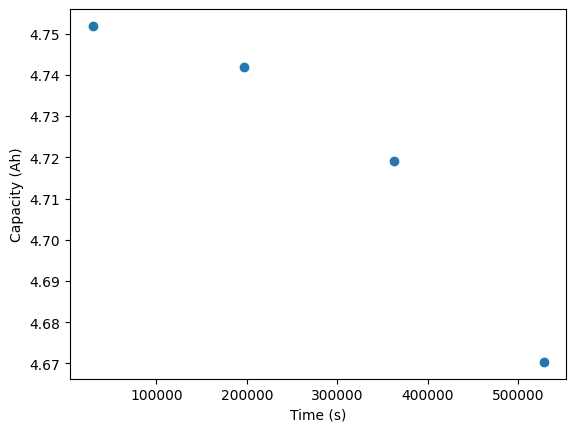
[28]:
fig, ax = plt.subplots()
ax.plot(Data["Test_Time[s]"], results["Capacity[Ah]"], marker="o")
ax.set_xlabel("Time (s)")
ax.set_ylabel("Capacity (Ah)")
plt.show()
[ ]: