Tutorial 4 - iOCV#
[1]:
import matplotlib.pyplot as plt

import pydpeet as eet

eet.set_logging_style("ERROR")
OCVs are Importend for Analyzing Materials, Ageeing and for Parametrisiation of Models. Here the Funtion from Squences is used to automatically extract incremntall OCVs from Lab-Data and analyze it through DVA and ICA
[ ]:
Data = eet.read(config="neware_8_0_0_516", input_path=r"..\..\res\raw\Cal_Ageing_Checkup3.xlsx")
[3]:
LGM50LT = eet.BatteryConfig(
    c_ref=4.75,
    max_voltage=4.2,
    min_voltage=2.5,
)
[4]:
Data.head()
[4]:
| Meta_Data | Step_Count | Voltage[V] | Current[A] | Temperature[°C] | Test_Time[s] | Date_Time | EIS_f[Hz] | EIS_Z_Real[Ohm] | EIS_Z_Imag[Ohm] | EIS_DC[A] | |
|---|---|---|---|---|---|---|---|---|---|---|---|
| 0.0 | 20240419100603-CheckUp-1-6-AM23NMC00009.xlsx U... | 0 | 3.5353 | 1.4396 | 30.1 | 0.0 | 2024-04-19 10:06:03 | None | None | None | None |
| 1.0 | None | 0 | 3.5368 | 1.4397 | 30.1 | 1.0 | 2024-04-19 10:06:04 | None | None | None | None |
| 2.0 | None | 0 | 3.5379 | 1.4398 | 30.1 | 2.0 | 2024-04-19 10:06:05 | None | None | None | None |
| 3.0 | None | 0 | 3.5388 | 1.4398 | 29.9 | 3.0 | 2024-04-19 10:06:06 | None | None | None | None |
| 4.0 | None | 0 | 3.5396 | 1.4399 | 29.9 | 4.0 | 2024-04-19 10:06:07 | None | None | None | None |
[5]:
OCVs = eet.extract_ocv_iocv(df=Data, config=LGM50LT, visualize=False)
[6]:
OCVs[0].head()
[6]:
| Test_Time[s] | Voltage[V] | Current[A] | Power[W] | ID | Meta_Data | Step_Count | Temperature[°C] | Date_Time | EIS_f[Hz] | ... | Length | Min | Max | Avg | Type | Direction | Slope | Capacity[Ah] | SOC | iOCV_type | |
|---|---|---|---|---|---|---|---|---|---|---|---|---|---|---|---|---|---|---|---|---|---|
| 44008.0 | 44002.6 | 4.1934 | 0.0 | 0.0 | 9 | None | 5.0 | 25.7 | 2024-04-19 22:19:24 | None | ... | 899.0 | 0.0 | 0.0 | 0.0 | Rest | Neutral | 0.0 | NaN | 1.000000 | Discharge |
| 44516.0 | 44508.1 | 4.1683 | 0.0 | 0.0 | 11 | None | 7.0 | 25.9 | 2024-04-19 22:27:50 | None | ... | 359.0 | 0.0 | 0.0 | 0.0 | Rest | Neutral | 0.0 | NaN | 1.000000 | Discharge |
| 45024.0 | 45013.6 | 4.1500 | 0.0 | 0.0 | 13 | None | 9.0 | 25.7 | 2024-04-19 22:36:16 | None | ... | 359.0 | 0.0 | 0.0 | 0.0 | Rest | Neutral | 0.0 | NaN | 0.991777 | Discharge |
| 45532.0 | 45519.1 | 4.1361 | 0.0 | 0.0 | 15 | None | 11.0 | 25.7 | 2024-04-19 22:44:41 | None | ... | 359.0 | 0.0 | 0.0 | 0.0 | Rest | Neutral | 0.0 | NaN | 0.983555 | Discharge |
| 46040.0 | 46024.6 | 4.1252 | 0.0 | 0.0 | 17 | None | 13.0 | 25.7 | 2024-04-19 22:53:07 | None | ... | 359.0 | 0.0 | 0.0 | 0.0 | Rest | Neutral | 0.0 | NaN | 0.975332 | Discharge |
5 rows × 25 columns
[7]:
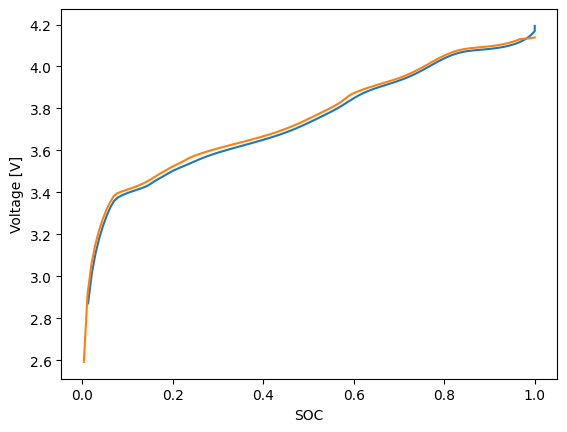
fig, ax = plt.subplots()

for ocv in OCVs:
    ax.plot(ocv["SOC"], ocv["Voltage[V]"], linestyle="-")
    ax.set_xlabel("SOC")
    ax.set_ylabel("Voltage [V]")