Tutorial 01 - read() and ReadConfig#
Step 0: Setup the project and prepare the data#
[1]:
import pydpeet as eet
The raw data used in this example is saved under the following path:
[2]:
from pathlib import Path

data_folder_path = Path.cwd().parent.parent / "res" / "raw_data_from_cyclers"
The raw example data used in this example looks like this:
[3]:
from IPython.display import display
from pandas import read_excel

sheets = read_excel(data_folder_path / "Cal_Ageing_Checkup1.xlsx", sheet_name=None, engine="calamine")
[4]:
sheet_names = list(sheets.keys())

for sheet_name in sheet_names[3:5]:
    print(f"\nSheet: {sheet_name}")
    display(sheets[sheet_name].head(6))

# Show remaining sheet names
print("\n... more sheets:")
print(", ".join(sheet_names[:3] + sheet_names[5:]))
Sheet: step
| Cycle Index | Step Index | Step Number | Step Type | Step Time | Oneset Date | End Date | Capacity(Ah) | Energy(Wh) | Oneset Volt.(V) | End Voltage(V) | |
|---|---|---|---|---|---|---|---|---|---|---|---|
| 0 | 1 | 1 | 1 | CCCV Chg | 03:12:01.900 | 2024-02-01 10:09:04 | 2024-02-01 13:21:06 | 3.9174 | 15.3228 | 3.5269 | 4.2003 |
| 1 | 1 | 2 | 2 | Rest | 00:01:00.000 | 2024-02-01 13:21:06 | 2024-02-01 13:22:06 | 0.0000 | 0.0000 | 4.1990 | 4.1978 |
| 2 | 1 | 3 | 3 | CCCV DChg | 05:05:28.900 | 2024-02-01 13:22:06 | 2024-02-01 18:27:34 | 4.7768 | 17.6422 | 4.1754 | 2.5001 |
| 3 | 1 | 4 | 4 | Rest | 00:01:00.000 | 2024-02-01 18:27:34 | 2024-02-01 18:28:34 | 0.0000 | 0.0000 | 2.5018 | 2.5184 |
| 4 | 1 | 5 | 5 | CCCV Chg | 03:47:03.700 | 2024-02-01 18:28:34 | 2024-02-01 22:15:38 | 4.7811 | 18.2612 | 2.5634 | 4.2003 |
| 5 | 1 | 6 | 6 | Rest | 00:15:00.000 | 2024-02-01 22:15:38 | 2024-02-01 22:30:38 | 0.0000 | 0.0000 | 4.1990 | 4.1932 |
Sheet: record
| DataPoint | Step Type | Time | Total Time | Current(A) | Voltage(V) | Capacity(Ah) | Energy(Wh) | Date | Power(W) | |
|---|---|---|---|---|---|---|---|---|---|---|
| 0 | 1 | CCCV Chg | 00:00:00.000 | 00:00:00.000 | 1.4378 | 3.5269 | 0.0000 | 0.0000 | 2024-02-01 10:09:04 | 5.0709 |
| 1 | 2 | CCCV Chg | 00:00:01.000 | 00:00:01.000 | 1.4398 | 3.5287 | 0.0004 | 0.0014 | 2024-02-01 10:09:05 | 5.0804 |
| 2 | 3 | CCCV Chg | 00:00:02.000 | 00:00:02.000 | 1.4400 | 3.5298 | 0.0008 | 0.0028 | 2024-02-01 10:09:06 | 5.0828 |
| 3 | 4 | CCCV Chg | 00:00:03.000 | 00:00:03.000 | 1.4400 | 3.5307 | 0.0012 | 0.0042 | 2024-02-01 10:09:07 | 5.0842 |
| 4 | 5 | CCCV Chg | 00:00:04.000 | 00:00:04.000 | 1.4401 | 3.5315 | 0.0016 | 0.0056 | 2024-02-01 10:09:08 | 5.0856 |
| 5 | 6 | CCCV Chg | 00:00:05.000 | 00:00:05.000 | 1.4401 | 3.5323 | 0.0020 | 0.0071 | 2024-02-01 10:09:09 | 5.0869 |
... more sheets:
unit, test, cycle, log, idle, auxVol, auxTemp
We will use “ERROR” as the logging style for better readability of the notebook
[5]:
eet.set_logging_style("ERROR")
Step 1: Read the data and convert it into the standardized format#
Hint: You can type in “eet.ReadConfig.” to see all availiable Reader Configurations in most IDEs
[6]:
config = eet.ReadConfig.Neware_8_0_0_516
[7]:
standardized_data = eet.read(input_path=str(data_folder_path / "Cal_Ageing_Checkup1.xlsx"), config=config)
The standardized data looks like this:
[8]:
standardized_data.head(6)
[8]:
| Meta_Data | Step_Count | Voltage[V] | Current[A] | Temperature[°C] | Test_Time[s] | Date_Time | EIS_f[Hz] | EIS_Z_Real[Ohm] | EIS_Z_Imag[Ohm] | EIS_DC[A] | |
|---|---|---|---|---|---|---|---|---|---|---|---|
| 0.0 | 20240201100904-CheckUp-3-7-AM23NMC00009.xlsx U... | 0 | 3.5269 | 1.4378 | 27.8 | 0.0 | 2024-02-01 10:09:04 | None | None | None | None |
| 1.0 | NaN | 0 | 3.5287 | 1.4398 | 27.8 | 1.0 | 2024-02-01 10:09:05 | None | None | None | None |
| 2.0 | NaN | 0 | 3.5298 | 1.4400 | 27.8 | 2.0 | 2024-02-01 10:09:06 | None | None | None | None |
| 3.0 | NaN | 0 | 3.5307 | 1.4400 | 27.8 | 3.0 | 2024-02-01 10:09:07 | None | None | None | None |
| 4.0 | NaN | 0 | 3.5315 | 1.4401 | 27.8 | 4.0 | 2024-02-01 10:09:08 | None | None | None | None |
| 5.0 | NaN | 0 | 3.5323 | 1.4401 | 27.8 | 5.0 | 2024-02-01 10:09:09 | None | None | None | None |
Warning: Columns that contain only empty values are assigned the “object” dtype. After saving and reloading the file, pandas may silently infer a different dtype for these columns unless the dtype is explicitly defined during import. That’s why we opted to directly initalize them with “object” dtype.
[9]:
print(standardized_data.dtypes)
Meta_Data                     str
Step_Count                  int64
Voltage[V]                float64
Current[A]                float64
Temperature[°C]           float64
Test_Time[s]              float64
Date_Time          datetime64[us]
EIS_f[Hz]                  object
EIS_Z_Real[Ohm]            object
EIS_Z_Imag[Ohm]            object
EIS_DC[A]                  object
dtype: object
[10]:
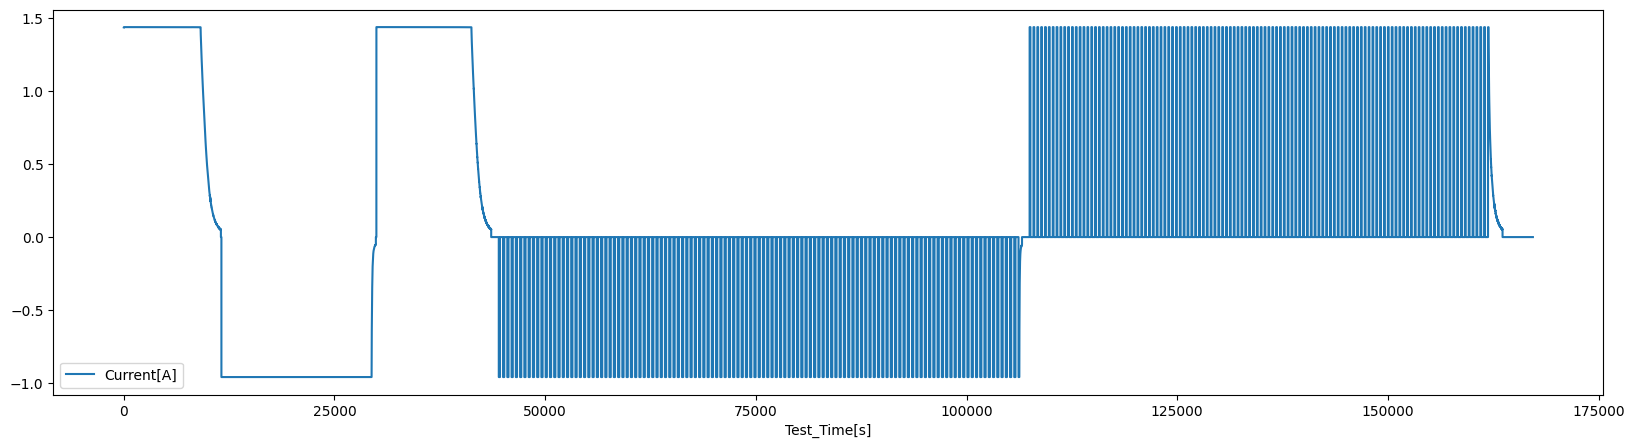
standardized_data.plot(x="Test_Time[s]", y="Current[A]", figsize=(20, 5))
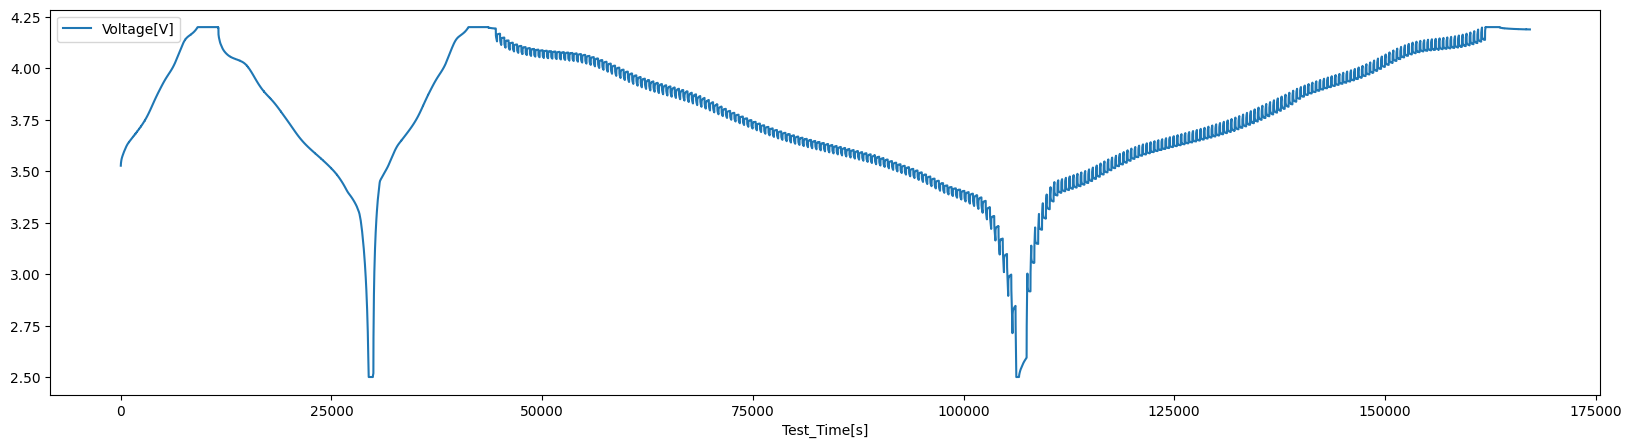
standardized_data.plot(x="Test_Time[s]", y="Voltage[V]", figsize=(20, 5))
[10]:
<Axes: xlabel='Test_Time[s]'>
Hint: Use “keep_all_additional_data = True”, to keep non standard data logged in your raw data
[11]:
standardized_data = eet.read(
    input_path=str(data_folder_path / "Cal_Ageing_Checkup1.xlsx"), config=config, keep_all_additional_data=True
)
[12]:
standardized_data.head(6)
[12]:
| Meta_Data | Step_Count | Voltage[V] | Current[A] | Temperature[°C] | Test_Time[s] | Date_Time | EIS_f[Hz] | EIS_Z_Real[Ohm] | EIS_Z_Imag[Ohm] | ... | Capacity(Ah)_y | Energy(Wh)_y | Power(W) | DataPoint - auxVol | Date - auxVol | V1 | Aux. ΔV | DataPoint - auxTemp | Date - auxTemp | Aux. ΔT | |
|---|---|---|---|---|---|---|---|---|---|---|---|---|---|---|---|---|---|---|---|---|---|
| 0.0 | 20240201100904-CheckUp-3-7-AM23NMC00009.xlsx U... | 0 | 3.5269 | 1.4378 | 27.8 | 0.0 | 2024-02-01 10:09:04 | None | None | None | ... | 0.0000 | 0.0000 | 5.0709 | 1 | 2024-02-01 10:09:04 | 0 | 0 | 1 | 2024-02-01 10:09:04 | 0 |
| 1.0 | NaN | 0 | 3.5287 | 1.4398 | 27.8 | 1.0 | 2024-02-01 10:09:05 | None | None | None | ... | 0.0004 | 0.0014 | 5.0804 | 2 | 2024-02-01 10:09:05 | 0 | 0 | 2 | 2024-02-01 10:09:05 | 0 |
| 2.0 | NaN | 0 | 3.5298 | 1.4400 | 27.8 | 2.0 | 2024-02-01 10:09:06 | None | None | None | ... | 0.0008 | 0.0028 | 5.0828 | 3 | 2024-02-01 10:09:06 | 0 | 0 | 3 | 2024-02-01 10:09:06 | 0 |
| 3.0 | NaN | 0 | 3.5307 | 1.4400 | 27.8 | 3.0 | 2024-02-01 10:09:07 | None | None | None | ... | 0.0012 | 0.0042 | 5.0842 | 4 | 2024-02-01 10:09:07 | 0 | 0 | 4 | 2024-02-01 10:09:07 | 0 |
| 4.0 | NaN | 0 | 3.5315 | 1.4401 | 27.8 | 4.0 | 2024-02-01 10:09:08 | None | None | None | ... | 0.0016 | 0.0056 | 5.0856 | 5 | 2024-02-01 10:09:08 | 0 | 0 | 5 | 2024-02-01 10:09:08 | 0 |
| 5.0 | NaN | 0 | 3.5323 | 1.4401 | 27.8 | 5.0 | 2024-02-01 10:09:09 | None | None | None | ... | 0.0020 | 0.0071 | 5.0869 | 6 | 2024-02-01 10:09:09 | 0 | 0 | 6 | 2024-02-01 10:09:09 | 0 |
6 rows × 62 columns
Hint: Use a path to a folder to convert all compatible files in the folder
[13]:
standardized_data_list = eet.read(input_path=str(data_folder_path), config=config)
[14]:
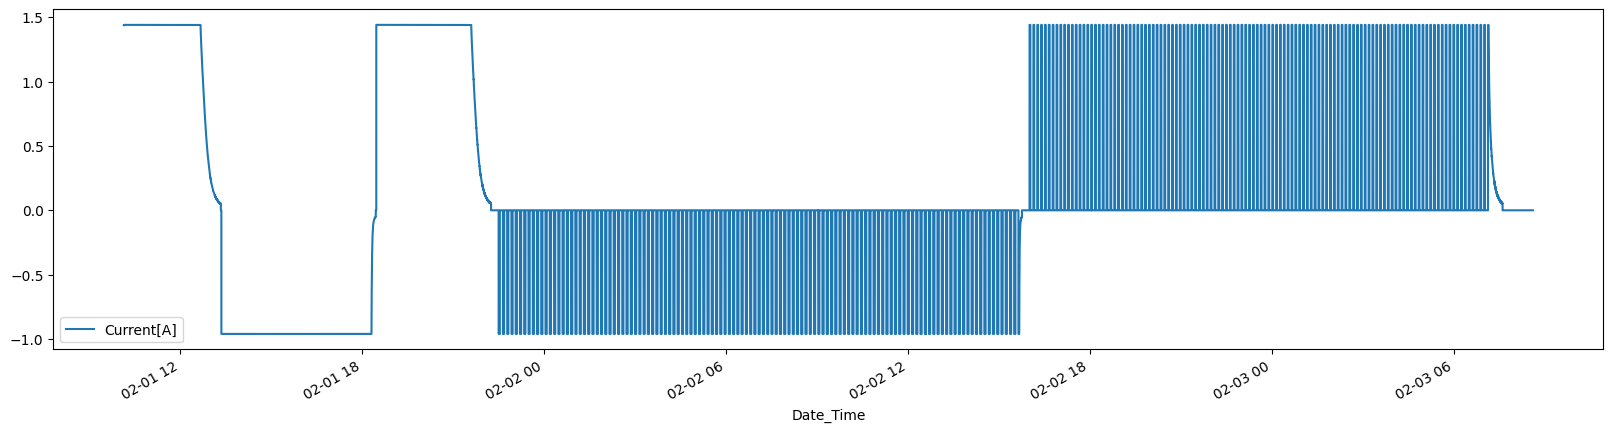
standardized_data_list[0].plot(x="Date_Time", y="Current[A]", figsize=(20, 5))
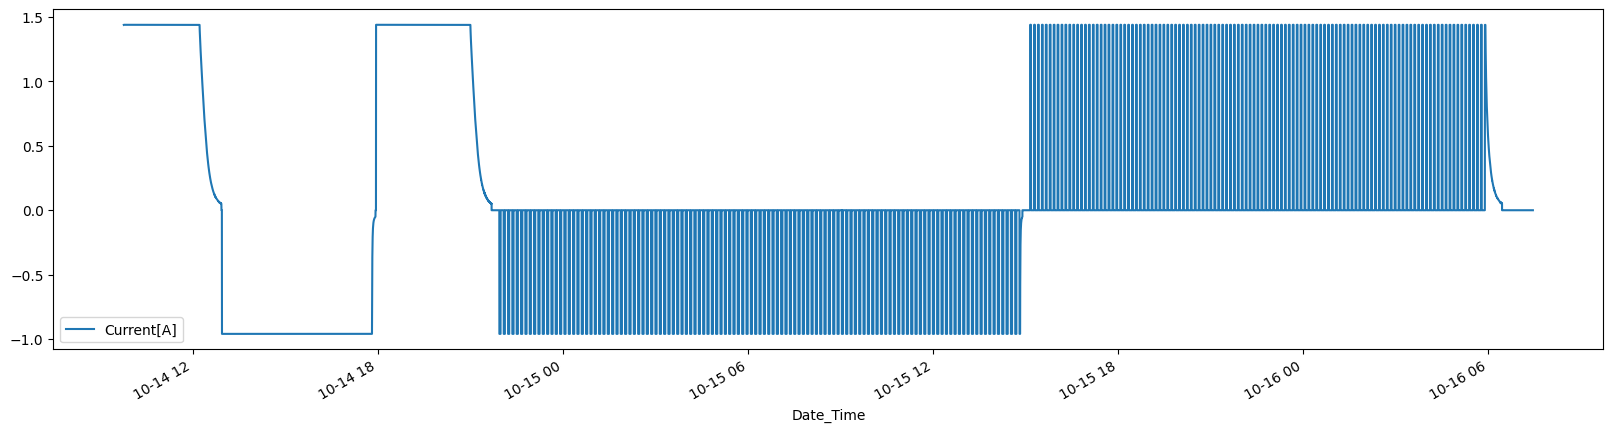
standardized_data_list[3].plot(x="Date_Time", y="Current[A]", figsize=(20, 5))
[14]:
<Axes: xlabel='Date_Time'>
Hint: It is also possible to call read without a config. It will then go alphabetically through all configs and returns the first non failing one.
Warning: Using no config is prone to Errors, so always doublecheck if the correct configs where used.
[15]:
data_with_automatically_selected_config = eet.read(input_path=str(data_folder_path))
[19]:
data_with_automatically_selected_config[0].head(6)
[19]:
| Meta_Data | Step_Count | Voltage[V] | Current[A] | Temperature[°C] | Test_Time[s] | Date_Time | EIS_f[Hz] | EIS_Z_Real[Ohm] | EIS_Z_Imag[Ohm] | EIS_DC[A] | |
|---|---|---|---|---|---|---|---|---|---|---|---|
| 0.0 | 20240201100904-CheckUp-3-7-AM23NMC00009.xlsx U... | 0 | 3.5269 | 1.4378 | 27.8 | 0.0 | 2024-02-01 10:09:04 | None | None | None | None |
| 1.0 | NaN | 0 | 3.5287 | 1.4398 | 27.8 | 1.0 | 2024-02-01 10:09:05 | None | None | None | None |
| 2.0 | NaN | 0 | 3.5298 | 1.4400 | 27.8 | 2.0 | 2024-02-01 10:09:06 | None | None | None | None |
| 3.0 | NaN | 0 | 3.5307 | 1.4400 | 27.8 | 3.0 | 2024-02-01 10:09:07 | None | None | None | None |
| 4.0 | NaN | 0 | 3.5315 | 1.4401 | 27.8 | 4.0 | 2024-02-01 10:09:08 | None | None | None | None |
| 5.0 | NaN | 0 | 3.5323 | 1.4401 | 27.8 | 5.0 | 2024-02-01 10:09:09 | None | None | None | None |