Tutorial 05.1 - add_primitive_segments, PrimitiveConfig, primitive_config_wrapper, DeviceConfig, calculate_minimum_definitive_differences#
Step 0: Setup the project and prepare the data#
[1]:
from pathlib import Path

import pydpeet as eet
We will use “ERROR” as the logging style for better readability of the notebook
[2]:
eet.set_logging_style("ERROR")
[3]:
standardized_data = eet.read(
    input_path=str(Path.cwd().parent.parent / "res" / "raw_data_from_cyclers" / "Cal_Ageing_Checkup1.xlsx"),
    config=eet.ReadConfig.Neware_8_0_0_516,
)
[4]:
standardized_data.plot(x="Test_Time[s]", y="Current[A]", figsize=(20, 5))
standardized_data.plot(x="Test_Time[s]", y="Voltage[V]", figsize=(20, 5))
[4]:
<Axes: xlabel='Test_Time[s]'>
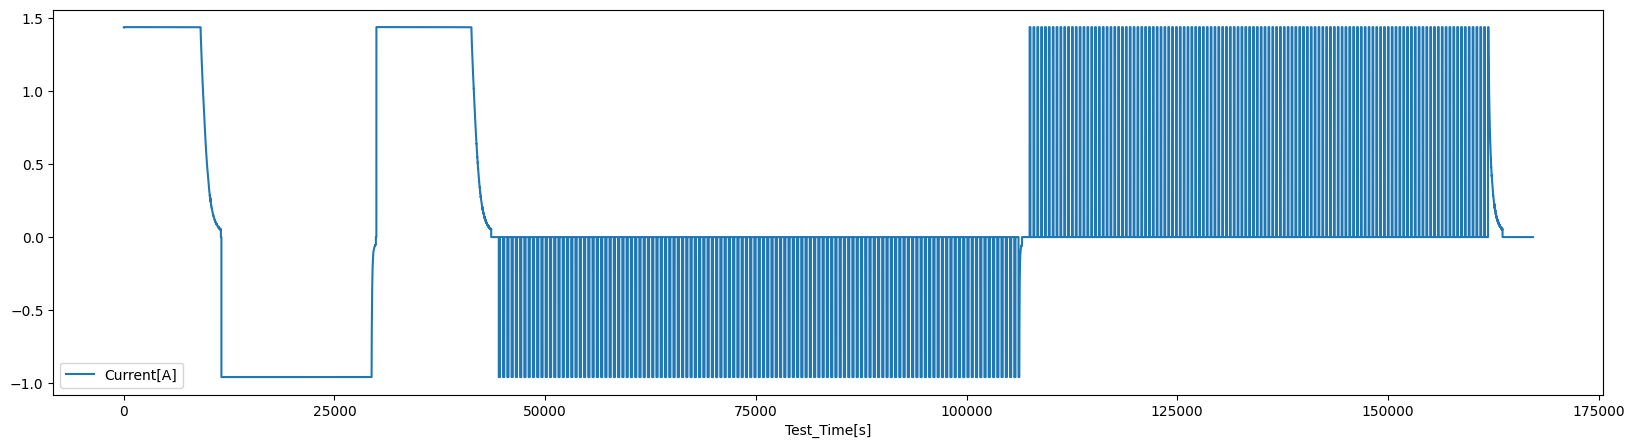
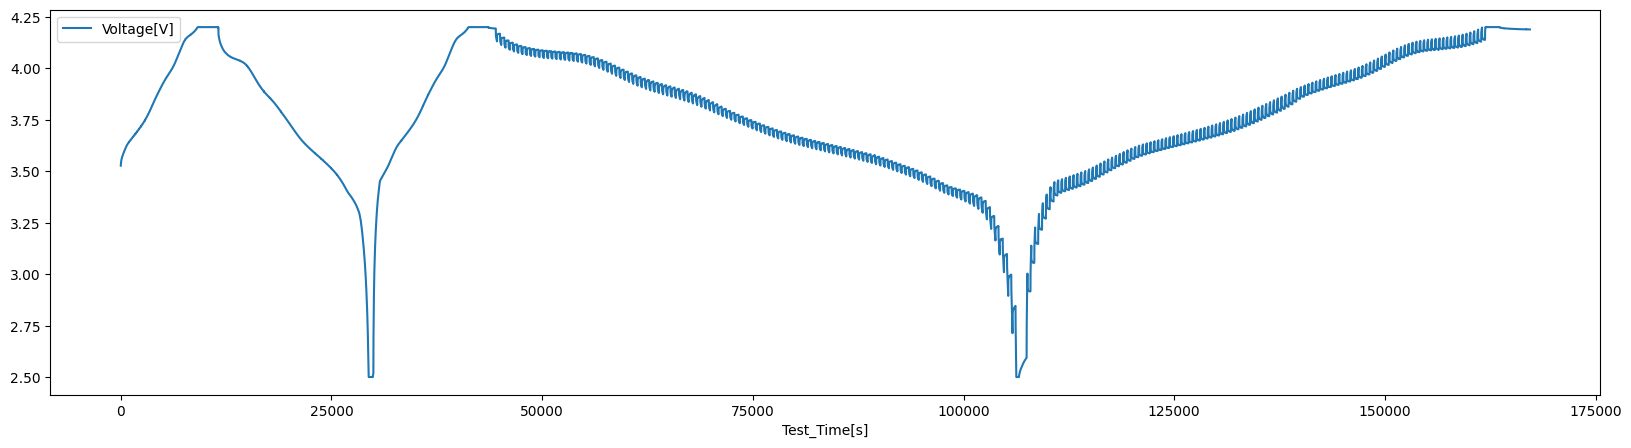
Step 1: Add primitive segments#
“add_primitive_segments” segments the data into quasi-linear segments (constant current, constant voltage, power ramp, …).
[5]:
segmented_data = eet.add_primitive_segments(df=standardized_data, config=eet.PrimitiveConfig.OCV_ANALYSIS_DEFAULT)
It adds the following columns to the dataframe:
[6]:
added_cols = [c for c in segmented_data.columns if c not in standardized_data.columns]
added_cols
[6]:
['Power[W]',
 'ID',
 'Variable',
 'Duration',
 'Length',
 'Min',
 'Max',
 'Avg',
 'Type',
 'Direction',
 'Slope']
[7]:
segmented_data[added_cols].tail(6)
[7]:
| Power[W] | ID | Variable | Duration | Length | Min | Max | Avg | Type | Direction | Slope | |
|---|---|---|---|---|---|---|---|---|---|---|---|
| 167857.0 | 0.0 | 497 | I | 3600.0 | 3599.0 | 0.0 | 0.0 | 0.0 | Rest | Neutral | 0.0 |
| 167858.0 | 0.0 | 497 | I | 3600.0 | 3599.0 | 0.0 | 0.0 | 0.0 | Rest | Neutral | 0.0 |
| 167859.0 | 0.0 | 497 | I | 3600.0 | 3599.0 | 0.0 | 0.0 | 0.0 | Rest | Neutral | 0.0 |
| 167860.0 | 0.0 | 497 | I | 3600.0 | 3599.0 | 0.0 | 0.0 | 0.0 | Rest | Neutral | 0.0 |
| 167861.0 | 0.0 | 497 | I | 3600.0 | 3599.0 | 0.0 | 0.0 | 0.0 | Rest | Neutral | 0.0 |
| 167862.0 | 0.0 | 497 | I | 3600.0 | 3599.0 | 0.0 | 0.0 | 0.0 | Rest | Neutral | 0.0 |
Hint: You can use segmented_data.groupby(“ID”).first() to get the first value of each segment
[8]:
segmented_data.groupby("ID")[added_cols].first()
[8]:
| Power[W] | ID | Variable | Duration | Length | Min | Max | Avg | Type | Direction | Slope | |
|---|---|---|---|---|---|---|---|---|---|---|---|
| ID | |||||||||||
| 1 | 5.070977 | 1 | V | 9112.0 | 9111.0 | 3.5269 | 4.2001 | 3.889836 | Ramp | Up | 7.388871e-05 |
| 2 | 6.036804 | 2 | V | 2411.0 | 2409.9 | 4.2001 | 4.2004 | 4.200252 | Constant | Charge | 8.298755e-08 |
| 3 | 0.000000 | 3 | I | 60.0 | 59.0 | 0.0000 | 0.0000 | 0.000000 | Rest | Neutral | 0.000000e+00 |
| 4 | -4.005888 | 4 | I | 17820.0 | 17819.0 | -0.9601 | -0.9599 | -0.960029 | Constant | Discharge | 5.611987e-09 |
| 5 | -2.330613 | 5 | V | 509.0 | 507.9 | 2.5000 | 2.5020 | 2.500138 | Constant | Discharge | -3.740157e-06 |
| ... | ... | ... | ... | ... | ... | ... | ... | ... | ... | ... | ... |
| 493 | 5.995934 | 493 | I | 98.0 | 96.1 | 1.4396 | 1.4399 | 1.439723 | Constant | Charge | 0.000000e+00 |
| 494 | 0.000000 | 494 | I | 360.0 | 359.0 | 0.0000 | 0.0000 | 0.000000 | Rest | Neutral | 0.000000e+00 |
| 495 | 6.007768 | 495 | I | 62.0 | 60.5 | 1.4387 | 1.4397 | 1.439615 | Constant | Charge | -1.147541e-05 |
| 496 | 5.996626 | 496 | V | 1664.0 | 1662.8 | 4.2002 | 4.2004 | 4.200271 | Constant | Charge | 6.013229e-08 |
| 497 | 0.000000 | 497 | I | 3600.0 | 3599.0 | 0.0000 | 0.0000 | 0.000000 | Rest | Neutral | 0.000000e+00 |
497 rows × 11 columns