Tutorial 10 - add_cumulative_energy#
Step 0: Setup the project and prepare the data#
[1]:
from pathlib import Path

import pydpeet as eet
We will use “ERROR” as the logging style for better readability of the notebook
[2]:
eet.set_logging_style("ERROR")
[3]:
standardized_data = eet.read(
    input_path=str(Path.cwd().parent.parent / "res" / "raw_data_from_cyclers" / "Cal_Ageing_Checkup1.xlsx"),
    config=eet.ReadConfig.Neware_8_0_0_516,
)
[4]:
eet.BatteryConfig.DEFAULT
[4]:
_BatteryConfigClass(cell_name='Default', c_ref=4.8, soc_start=0, max_voltage=4.2, min_voltage=2.5, threshold_current=0.075, voltage_intervall=0.01, minimal_current_for_capacity=-1.2, maximal_current_for_capacity=-0.8, min_current_diff=0.5, max_time_diff=0.5, min_voltage_diff=0, ignore_negative_resistance_values=False)
Step 1: add_cumulative_energy#
[5]:
df = eet.add_cumulative_energy(
    df=standardized_data,
    config=eet.BatteryConfig.DEFAULT,
    verbose=True,
)
[6]:
added_cols = [c for c in df.columns if c not in standardized_data.columns]
added_cols
[6]:
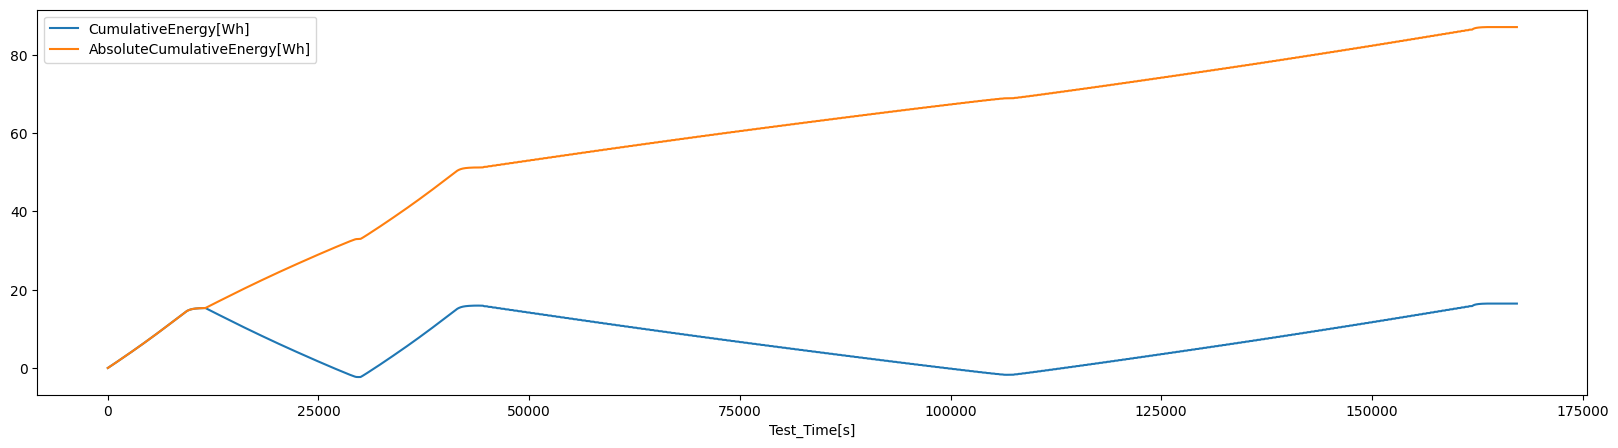
['Power[W]', 'CumulativeEnergy[Wh]', 'AbsoluteCumulativeEnergy[Wh]']
[7]:
df.head(6)
[7]:
| Meta_Data | Step_Count | Voltage[V] | Current[A] | Temperature[°C] | Test_Time[s] | Date_Time | EIS_f[Hz] | EIS_Z_Real[Ohm] | EIS_Z_Imag[Ohm] | EIS_DC[A] | Power[W] | CumulativeEnergy[Wh] | AbsoluteCumulativeEnergy[Wh] | |
|---|---|---|---|---|---|---|---|---|---|---|---|---|---|---|
| 0.0 | 20240201100904-CheckUp-3-7-AM23NMC00009.xlsx U... | 0 | 3.5269 | 1.4378 | 27.8 | 0.0 | 2024-02-01 10:09:04 | None | None | None | None | 5.070977 | 0.000000 | 0.000000 |
| 1.0 | None | 0 | 3.5287 | 1.4398 | 27.8 | 1.0 | 2024-02-01 10:09:05 | None | None | None | None | 5.080622 | 0.001410 | 0.001410 |
| 2.0 | None | 0 | 3.5298 | 1.4400 | 27.8 | 2.0 | 2024-02-01 10:09:06 | None | None | None | None | 5.082912 | 0.002822 | 0.002822 |
| 3.0 | None | 0 | 3.5307 | 1.4400 | 27.8 | 3.0 | 2024-02-01 10:09:07 | None | None | None | None | 5.084208 | 0.004234 | 0.004234 |
| 4.0 | None | 0 | 3.5315 | 1.4401 | 27.8 | 4.0 | 2024-02-01 10:09:08 | None | None | None | None | 5.085713 | 0.005646 | 0.005646 |
| 5.0 | None | 0 | 3.5323 | 1.4401 | 27.8 | 5.0 | 2024-02-01 10:09:09 | None | None | None | None | 5.086865 | 0.007059 | 0.007059 |
[9]:
df.plot(x="Test_Time[s]", y=["CumulativeEnergy[Wh]", "AbsoluteCumulativeEnergy[Wh]"], figsize=(20, 5))
[9]:
<Axes: xlabel='Test_Time[s]'>