Tutorial 08 - add_capacity#
Step 0: Setup the project and prepare the data#
[1]:
from pathlib import Path

import pydpeet as eet
We will use “ERROR” as the logging style for better readability of the notebook
[2]:
eet.set_logging_style("ERROR")
[5]:
standardized_dataframes = eet.read(
    input_path=str(Path.cwd().parent.parent / "res" / "raw_data_from_cyclers"),
    config=eet.ReadConfig.Neware_8_0_0_516,
)
[6]:
standardized_data_merged = eet.merge_into_series(standardized_dataframes)
[7]:
segmented_data = eet.add_primitive_segments(
    df=standardized_data_merged, config=eet.PrimitiveConfig.OCV_ANALYSIS_DEFAULT
)
[9]:
eet.visualize_phases(df=segmented_data, config=eet.VisualizationConfig.DEFAULT)

[10]:
eet.BatteryConfig.DEFAULT
[10]:
_BatteryConfigClass(cell_name='Default', c_ref=4.8, soc_start=0, max_voltage=4.2, min_voltage=2.5, threshold_current=0.075, voltage_intervall=0.01, minimal_current_for_capacity=-1.2, maximal_current_for_capacity=-0.8, min_current_diff=0.5, max_time_diff=0.5, min_voltage_diff=0, ignore_negative_resistance_values=False)
Step 1: add_capacity#
[11]:
df = eet.add_capacity(
    df=standardized_data_merged,
    df_primitives=segmented_data,
    config=eet.BatteryConfig.DEFAULT,
    neware_bool=True,
    verbose=True,
)
[12]:
added_cols = [c for c in df.columns if c not in standardized_data_merged.columns]
added_cols
[12]:
['Capacity[Ah]']
Warning: Capacity values are only added to the respective datarow at the end of a capacity determination step
[13]:
df_filtered = df[df["Capacity[Ah]"].notna()]
df_filtered
[13]:
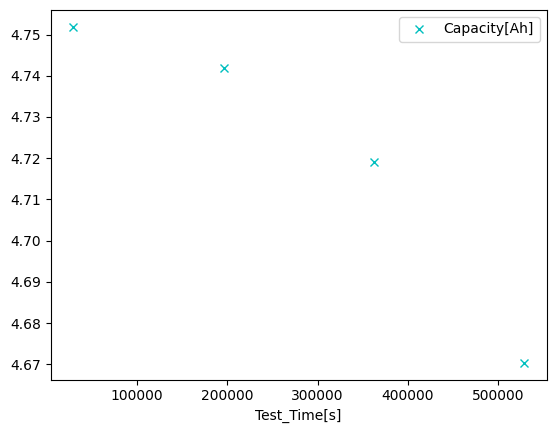
| Meta_Data | Step_Count | Voltage[V] | Current[A] | Temperature[°C] | Test_Time[s] | Date_Time | EIS_f[Hz] | EIS_Z_Real[Ohm] | EIS_Z_Imag[Ohm] | EIS_DC[A] | TestIndex | Capacity[Ah] | |
|---|---|---|---|---|---|---|---|---|---|---|---|---|---|
| 29402 | None | 2.0 | 2.5033 | -0.9599 | 25.4 | 29401.9 | 2024-02-01 18:19:06 | None | None | None | None | 0.0 | 4.751879 |
| 196463 | None | 2.0 | 2.5037 | -0.9599 | 26.0 | 196354.3 | 2024-02-23 01:31:07 | None | None | None | None | 1.0 | 4.741869 |
| 362952 | None | 2.0 | 2.5036 | -0.9600 | 26.2 | 362733.4 | 2024-04-19 18:10:25 | None | None | None | None | 2.0 | 4.719156 |
| 528816 | None | 2.0 | 2.5036 | -0.9599 | 25.7 | 528488.4 | 2024-10-14 17:48:51 | None | None | None | None | 3.0 | 4.670351 |
[14]:
df_filtered.plot(x="Test_Time[s]", y="Capacity[Ah]", style="cx")
[14]:
<Axes: xlabel='Test_Time[s]'>